
A successful mailing campaign is only as good as the quality of the data your campaign is using. If your mailing database is full of errors, incorrect addresses, or old...
Hey everyone, Rick here back with another podcast episode that I’m dyin’ to tell you about! This time I was joined by Barry Gold and Mike Valant from Think Data Group talking about Big Data. These guys have over 80 years of combined experience in the industry, and they dropped a wealth of knowledge on us.
LET’S TALK BIG DATA
How do you define it?
We tend to think of Big Data as anything that can't be processed quickly or there’s so much of it that a traditional spreadsheet or data system can’t handle it, or if it can, it can’t do it quickly enough. Years ago, marketing data would not have fit this criteria. Today? It especially does.
Barry points out that about 10 years ago, there were maybe eight Big Data categories, such as geo-locations, e-commerce, social media, exhaust, little specialties, etc. Now? There are over FORTY, including internet, global data, unstructured data, life events, and so on. Technology use has grown to the point that there are 25 billion gigabytes of data being created every single day. 😱
To put it plainly, there really isn’t a category that couldn’t be considered today.
With that much data floating around, you have to have a way to organize and manage it in order to run your business effectively. (Shameless plug, check out our previous episode on The Corporate Data show where we talk about the importance of historical data organization!)
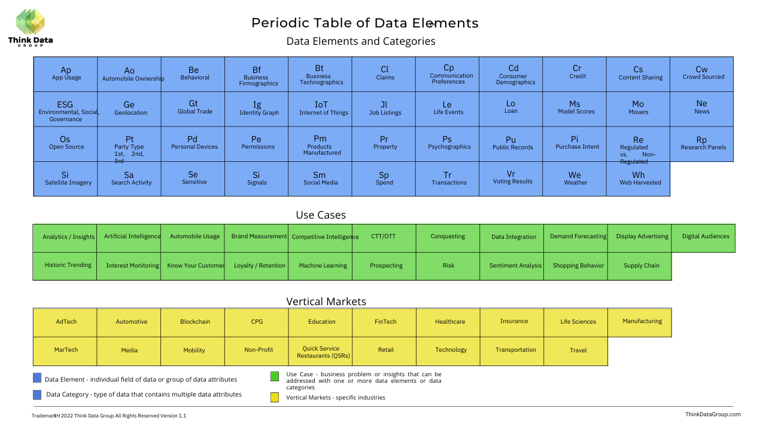
ENTER THE PERIODIC TABLE OF DATA ELEMENTS
Mike has created the Periodic Table of Data Elements to help you use data to optimize your business. You can think of it as a framework for understanding the volume, variety and velocity of data. The table is organized into three categories:
It reminds me of the Scott Brinker “Martech 5000” graphic, and looks like it can be a real game-changer for creating strategy within the data industry. And whether you’re dealing with Mega Trends or Mega Sources, regardless of the data set you’re choosing, you need a strategy.
GET YOUR POTATOES IN ORDER!
A case study in the supply chain area developed by Mike demonstrates the power of The Periodic Table of Data Elements as a tool, both on the buyer and seller sides to give perspective on the broad marketplace and the client-specific use cases.
A perfect example: Imagine being an executive in a quick serve restaurant responsible for maintaining a healthy supply chain, assessing both risk and competitive intelligence.
Let’s start with potatoes. Is there a risk to the supply?
The model suggests looking at weather forecasts and trends over time to see when there’s risk (ex: droughts, fires) and that’ll help you decide if you need to look to other parts of the world. You may need to look at satellite imagery to see where potato farms are doing well, as well as global trade data to see where other companies are sourcing potatoes. Is it Latin America? Europe? Southeast Asia? Find out where the most productive new sources for materials are. And what about company credit scores? Property risk scores (flood plains, high fire area, high crime, etc.)? You might even look into the e-commerce relationships for other companies in your business as well.
The table is organized in use cases across vertical markets, making an even more valuable tool. The options could go on forever, but simply put, this Periodic Table can help your business tremendously. Make sure you reach out to Barry or Mike for full case studies and uses!
In the meantime, be sure to check back in for more tips to help you do your best work, and hit us up with any and all of your data needs!
As I mentioned in the episode, Every Market Media is enthusiastically hiring! Be sure to reach out with any questions or interests at careers@everymarketmedia.com!
A successful mailing campaign is only as good as the quality of the data your campaign is using. If your mailing database is full of errors, incorrect addresses, or old...

Hey everyone, it's been a long winter but I'm back and ready to tell you about my most recent podcast episode! Ed Locher of HG Insights joined me on The Corporate Data...